

This is an Android crash log:
--------- beginning of crash
AndroidRuntime: FATAL EXCEPTION: main
Process: com.android.developer.crashsample, PID: 3686
java.lang.NullPointerException
	at com.android.developer.crashsample.ComposableSingletons$MainActivityKt.lambda$0(MainActivity.kt:27)
	at androidx.compose.foundation.ClickableNode.handleUpEvent(Clickable.kt:958)
	...
	at com.android.internal.os.ZygoteInit.main(ZygoteInit.java:918)
That is Android’s own example from its crash documentation. Android crash logs live in more places than that one, though, and the right one depends on what failed. A Java or Kotlin exception goes to logcat’s crash buffer, which adb logcat -b crash prints. An ANR leaves a trace in /data/anr. A native crash prints a short dump to logcat and writes a full tombstone to /data/tombstones/. On a user’s phone you get none of these directly: you get Play Console’s Android vitals, a crash reporter, or, from Android 11, the app asking the OS why its last process died.
This guide covers where each one lives, how to get it, and how to read it, including the obfuscated traces an R8 release build produces. It is for native Android apps and the Android side of React Native apps. For iOS this is the wrong page. For Roku, see Roku crash logs.
Which crash log you need
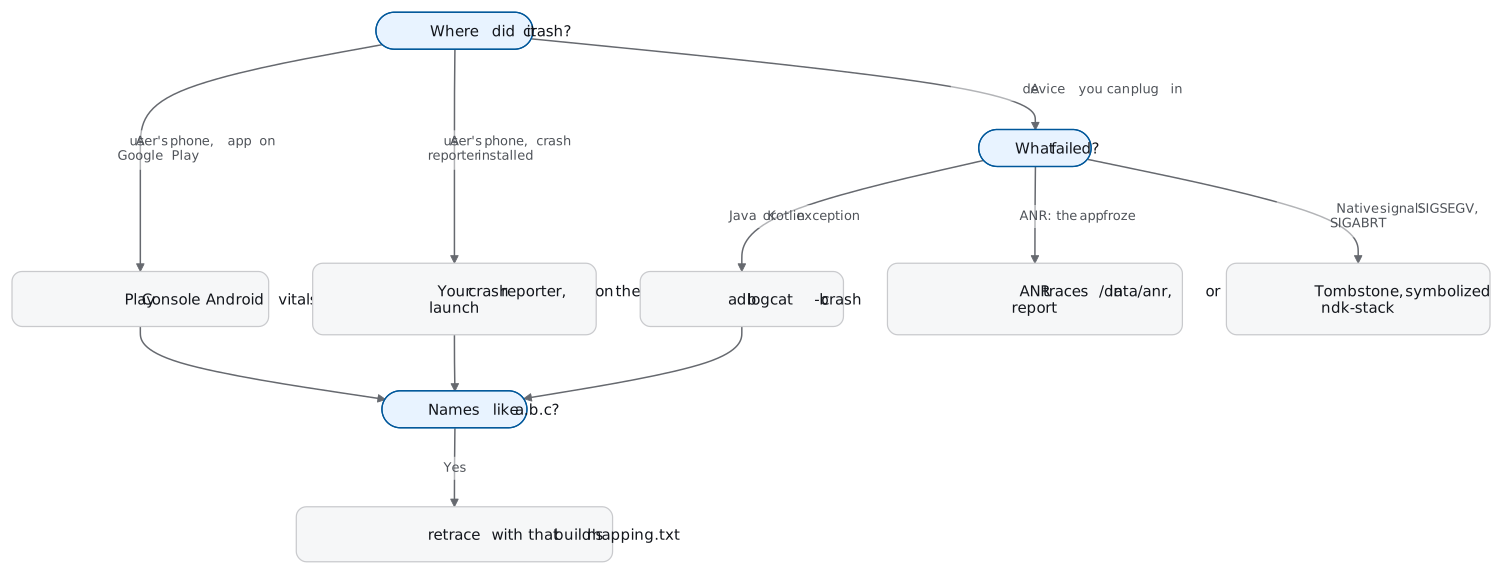
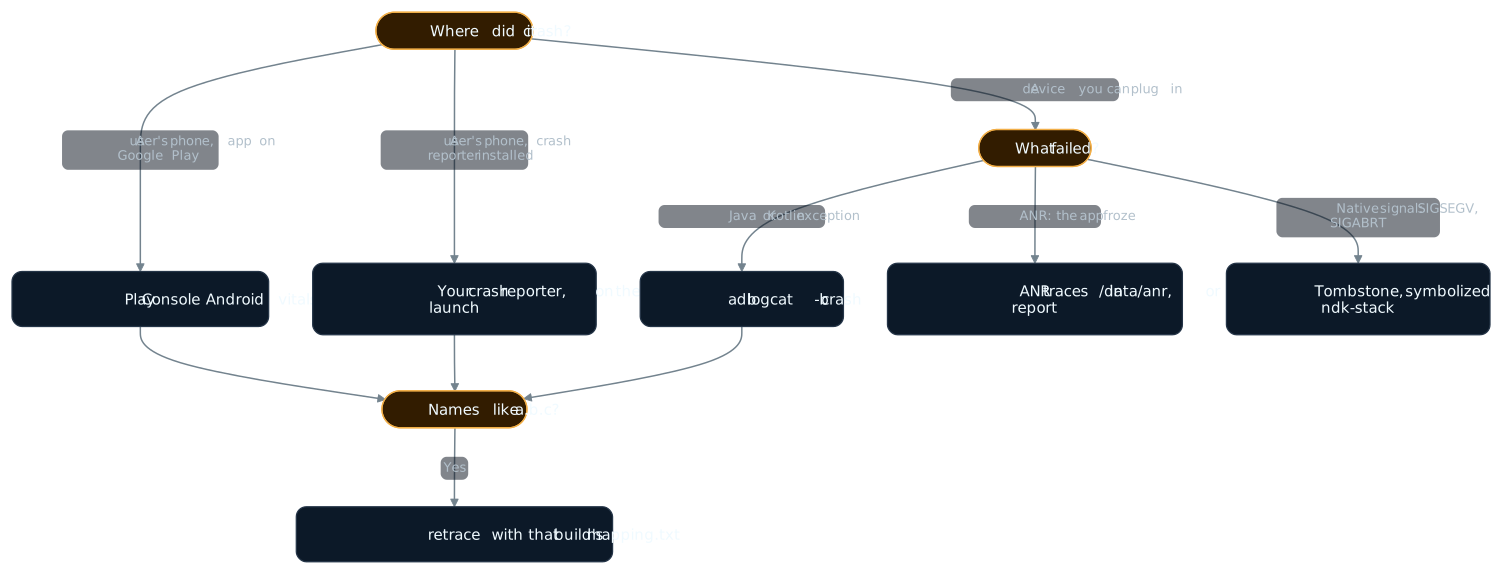
| Failure | Where Android writes it | How you get it |
|---|---|---|
| Java or Kotlin exception | logcat crash buffer | adb logcat -b crash, or Android Studio’s Logcat with is:crash |
| ANR | /data/anr/anr_* files, /data/anr/traces.txt on older releases | adb root, then adb pull /data/anr/<file>; or a bug report |
| Native crash | Short dump in logcat, full tombstone in /data/tombstones/ | A bug report, or the logcat dump fed to ndk-stack |
| Any of the above, after the fact | The OS exit record, Android 11+ | ActivityManager.getHistoricalProcessExitReasons from your own app |
| Crashes on users’ phones | Google Play | Play Console: Monitor and improve > Android vitals > Crashes and ANRs |
Logcat: the crash buffer
Logcat is where a Java or Kotlin crash log shows up first. Android keeps several circular log buffers, and crash logs have their own:
adb logcat -b crashadb logcat is shorthand for adb shell logcat, and -b picks the buffer. With no -b, logcat shows the main, system and crash buffers together. The main buffer on its own does not contain crash messages. A tool or script that reads only main will miss the crash it is looking for. To read several buffers at once, list them: adb logcat -b main,system,crash.
The buffers are circular, so pull the log soon after the crash. On a busy device, newer output pushes older entries out.
In Android Studio, the Logcat window shows the exception and its stack trace with links into your code. Two queries do most of the work. is:crash matches Java and native app crashes. package:mine limits output to the packages in the open project. When your process dies and restarts, Logcat prints PROCESS ENDED and PROCESS STARTED, so you can see where one run ended.
How to read a Java or Kotlin stack trace
Here is an illustrative crash. The package, classes and line numbers are made up:
FATAL EXCEPTION: main
Process: com.example.shop, PID: 4120
java.lang.RuntimeException: Unable to start activity ComponentInfo{com.example.shop/com.example.shop.CheckoutActivity}: java.lang.IllegalStateException: cart not loaded
	at android.app.ActivityThread.performLaunchActivity(ActivityThread.java:...)
	at android.app.ActivityThread.handleLaunchActivity(ActivityThread.java:...)
	...
Caused by: java.lang.IllegalStateException: cart not loaded
	at com.example.shop.CartRepository.requireCart(CartRepository.kt:58)
	at com.example.shop.CheckoutActivity.onCreate(CheckoutActivity.kt:31)
	at android.app.Activity.performCreate(Activity.java:...)
	... 12 more
Read it in this order:
- The exception type. Android's crash guide calls it a strong hint about what went wrong. Look up the class before you look at the code.
- The last "Caused by". When one exception wraps another, the trace prints the original under a "Caused by:" header. Read the bottom one first. In this example, the top line only says the activity failed to start, and the cause says why.
- The first frame in your package. Under that cause, the first "at" line is where the exception was thrown. Here it is
CartRepository.kt:58, called fromCheckoutActivity.onCreate. Start there and walk up the stack to find who passed the bad value. - Ignore "... 12 more". It means the rest of that cause's trace matches the frames of the exception that wraps it, so nothing is hidden.
If none of your code appears in the trace, Android’s crash guide says you probably passed an invalid parameter into an asynchronous operation. Check the framework classes the trace names and what you handed them.
A trace from somewhere else, such as a Play Console report or a tester’s message, opens in Android Studio with Analyze > Analyze Stacktrace. Paste it in and the frames link into your project. Check out the same version of the app that crashed first. Otherwise the file names and line numbers will not line up.
ANR traces
An ANR is not an exception, so there is no “Caused by” to read. Android raises one when your app has not responded to an input event within 5 seconds, when a BroadcastReceiver has not finished in time (10 seconds for a broadcast sent with FLAG_RECEIVER_FOREGROUND and 60 seconds without it, through Android 13; 10 to 20 and 60 to 120 seconds from Android 14, longer when the process is CPU-starved — Android’s timeout table), or when a service started with startForegroundService does not call startForeground within 5 seconds.
Android stores ANR traces in /data/anr: one traces.txt file on older releases, several anr_* files on newer ones. Reading them needs adb as root:
adb root
adb shell ls /data/anr
adb pull /data/anr/<filename>
On a physical device, Android’s ANR guide points to a bug report instead, from the Take bug report developer option or adb bugreport. In the trace, find the main thread and read what it was waiting on when the clock ran out.
Native crashes: the Android crash dump and the tombstone
When native code crashes, Android writes two things. A basic crash dump goes to logcat, starting with a line of asterisks. A tombstone goes to /data/tombstones/, with stack traces for every thread in the process, a full memory map and the list of open file descriptors. The last line of the logcat dump gives the tombstone’s path. Since Android 8.0, crash_dump32 and crash_dump64 write them. Before that, the debuggerd daemons did.
An illustrative dump. The process and library names are made up:
*** *** *** *** *** *** *** *** *** *** *** *** *** *** *** ***
Build fingerprint: 'google/foo/bar:10/123.456/78910:user/release-keys'
ABI: 'arm64'
pid: 4120, tid: 4120, name: com.example.shop  >>> com.example.shop <<<
signal 11 (SIGSEGV), code 1 (SEGV_MAPERR), fault addr 0x0
Cause: null pointer dereference
backtrace:
      #00 pc 000000000001a2b4  /data/app/.../lib/arm64/libshop.so
      #01 pc 000000000001a0f0  /data/app/.../lib/arm64/libshop.so
Read the header first:
- Build fingerprint and ABI name the exact build and architecture.
- pid, tid and name name the crashing thread and the process it belongs to.
- The signal line is the headline. AOSP calls
SIGSEGVwith fault address0x0“the classic native crash”, a null pointer dereference. - Cause appears on some crashes and says what Android thinks happened.
- Abort message appears when the process called
abortor an assertion failed. AOSP says aborts are deliberate, so forSIGABRTread the logcat lines that thread wrote just before it died.
In the backtrace, frame #00 is where execution was when the signal arrived. Frames from a stripped release library have no function names. That is what symbolizing fixes.
ndk-stack replaces each address inside your libraries with a source file and line number. It needs the unstripped libraries from the same build. For a Gradle build they are under <project>/build/intermediates/cxx/<build-type>/<hash>/obj/<abi>:
adb logcat | $NDK/ndk-stack -sym <path-to-unstripped-libs>/arm64-v8aIt also accepts a saved file with -dump. It starts parsing at the line of asterisks, so keep that line when you copy a dump out of logcat.
To get the full tombstone off a device, take a bug report. The report zip copies device files under an FS folder, and AOSP’s own debugging guide runs its symbolizer on FS/data/tombstones/tombstone_05. What else the zip holds, and how to capture one from Developer options, the emulator or adb bugreport, is in Android bug report: what it captures and what it misses.
ApplicationExitInfo: ask the OS why the app died
Everything above needs a device on your desk. From Android 11 (API level 30), the app can ask the OS itself:
val am = getSystemService(ActivityManager::class.java)
val exits = am.getHistoricalProcessExitReasons(packageName, 0, 5)
for (exit in exits) {
    when (exit.reason) {
        ApplicationExitInfo.REASON_CRASH -> { /* unhandled Java or Kotlin exception */ }
        ApplicationExitInfo.REASON_CRASH_NATIVE -> { /* native crash */ }
        ApplicationExitInfo.REASON_ANR -> { /* ANR: exit.traceInputStream has the trace */ }
        ApplicationExitInfo.REASON_LOW_MEMORY -> { /* low memory killer */ }
    }
}
A pid of 0 returns every matching record, newest first. Each record says why the process ended and when. For an ANR, getTraceInputStream() returns the trace the system took. From API 31, it returns the tombstone for a native crash, as a protobuf.
Three limits shape how you use it:
- It is a ring buffer. Only the most recent exits are kept. Read them on the next launch, not a week later.
- Traces can be missing. They sit in a global circular buffer that newer crashes, including other apps' crashes, can overwrite.
getTraceInputStream()can return null. - Low-memory kills are not always labelled. On devices that do not support reporting
REASON_LOW_MEMORY, a memory-pressure kill comes back asREASON_SIGNALEDwithSIGKILL.
A crash reporter that reads this record on the next launch can report ANRs and native crashes without running anything at the moment of death. That is also why such reports arrive late.
DeadSystemException: the crash that is not yours
Sometimes the crash log names android.os.DeadSystemException, or a RuntimeException wrapping one. Android’s reference defines it in two sentences: “The core Android system has died and is going through a runtime restart. All running apps will be promptly killed.”
It was added in API level 24 and extends DeadObjectException. When your app calls a system service and system_server has died, the framework throws a DeadSystemRuntimeException with a DeadSystemException inside. AOSP’s source comment is blunt: “There’s nothing apps can do at this point - the system will automatically restart - so there’s no point in catching this.”
So the stack trace points at your call into the system, but the cause is the system process. Look at the logs from before it, filter these crashes into their own group, and check whether they cluster on one device model or OS version. A plain DeadObjectException from your own bound service is different. AOSP’s guidance there is to drop the binder, clean up, and reconnect.
Obfuscated traces: R8, mapping.txt and retrace
A release build shrunk by R8 produces traces like at a.b.c(Unknown Source:4). R8 can rename classes and methods and change line numbers, so the trace no longer refers to your source. Each build writes a mapping.txt that maps the new names back.
Run R8 retrace with the mapping from the build that crashed. Android’s docs give this form, from the project root:
$ANDROID_HOME/cmdline-tools/latest/bin/retrace \
  app/build/outputs/mapping/release/mapping.txt trace.txt
The syntax is retrace path-to-mapping-file [path-to-stack-trace-file]. Leave out the trace file and it reads standard input, so you can paste a trace in. It ships with the command-line tools package from version 4.0. From Android Studio Otter 3 Feature Drop and AGP 9.0, the Logcat window retraces stack traces by itself.
Android Studio overwrites mapping.txt on every build. Android's own docs tell you to save a copy each time you publish a release. A trace from version 41 cannot be retraced with version 42's mapping. Archive the file next to the build, or let your crash reporter upload it.
Google Play handles this for you if you ship an app bundle built with AGP 4.1 or later, because it reads the mapping from the bundle. For an APK, upload the file in Play Console’s App bundle explorer. Only crashes that arrive after the upload are deobfuscated. Native frames need native debug symbols instead: set android.defaultConfig.ndk.debugSymbolLevel to FULL in the app’s Gradle file, or SYMBOL_TABLE if the file goes over Play’s 800 MB limit.
React Native R8 builds
In a React Native app, R8 shrinking is a one-line switch in android/app/build.gradle:
def enableProguardInReleaseBuilds = trueReact Native’s docs warn that it often needs configuration for each native library, in app/proguard-rules.pro. Once it is on, the Java and Kotlin frames in your Android crash logs (your native modules and the libraries under them) are obfuscated like any other R8 build, and mapping.txt plus retrace reads them the same way. JavaScript frames come from the JavaScript bundle and are mapped with its source map instead.
Production: why device logs stop working
Every method above assumes you can reach the device, and production crashes happen on phones you will never see. logcat needs a USB or wireless adb connection. /data/anr needs root. The tombstone is gone by the time the user tells you about it, if they ever do. Android error reporting in production is a different set of tools: each Android crash report comes from a phone you never touch.
Play Console Android vitals
Crashes and ANRs from users who share diagnostics data, grouped into clusters. Nothing to install.
A crash reporter SDK
Runs in your app, records each crash on the device, and sends it on the next launch with your own context attached.
ApplicationExitInfo
The OS's own exit record on Android 11 and later, readable by your app on the next launch.
Android vitals is in Play Console under Monitor and improve > Android vitals > Crashes and ANRs. It groups crashes into clusters that may share a root cause. It uses data only from users who agreed to share usage and diagnostics data. Between it and Crashlytics, it is the only one with ANRs from Android 10 and below, because those come from the OS rather than the next launch. Third-party reporters such as Sentry cover that range with a watchdog thread instead, a heuristic that can report false positives (Sentry). Vitals also affects distribution. Its bad behavior thresholds are a user-perceived crash rate of 1.09% overall or 8% on any one phone model, and a user-perceived ANR rate of 0.47% overall or 8% per phone model. Play uses the last 28 days of data. Over a threshold, Play may reduce your app’s visibility or show a warning on its store listing.
A crash reporter fills the gaps vitals leaves: users who did not opt in, your own breadcrumbs and user IDs, and alerts you control. Firebase Crashlytics, part of Google’s Firebase, is one. Once set up, it monitors an Android app for crashes, non-fatal errors and ANRs. Native crashes need its separate NDK setup. Its Gradle plugin uploads the R8 mapping file on its own. Its ANR coverage has a documented edge: Crashlytics reports ANRs only from Android 11 and higher, and only when the app next starts, while Android vitals sends ANR data after the ANR occurs. Expect the two ANR counts to differ.
Where Everframe fits
Everframe is one of those crash reporters, with a different emphasis. Its Android SDK files crashes into the same report format as the bug reports your testers file, so a crash and a human report about the same screen read the same way.
What it does on Android, per the Crash reporting docs:
- Crash reporting is on by default. One
Everframe.startcall enables it. Uncaught Java and Kotlin exceptions,OutOfMemoryErrorincluded, are reported on every Android version the SDK supports, which starts at API 24. - On Android 11 and later it also reports native crashes, ANRs, and low-memory kills while the user could see or hear the app. It reads them from the OS exit record on the next launch. ANR reports carry the main thread’s frames. Native crash reports on Android 12 and later carry the native frames from the tombstone. Android 11 native crashes arrive without stack frames.
- Mapped stacks. The
dev.everframeGradle plugin uploadsmapping.txtand your unstripped native libraries after each release build, so traces open retraced with the raw frames still available. See Android R8. - The trail before the crash. Each crash report carries the breadcrumbs that led to it (screens, taps, log lines, network calls), plus the device and the user if you set one. You read what the user did before the crash next to the stack.
- It chains to your existing handler. The SDK records first, then calls through to whatever handler was installed before it, such as Crashlytics, so both keep working.
- Crash-free rates. Crash-free sessions are shown per release, and a webhook alert fires when a version drops below your target.
What it does not do. On Android 7 to 10 it reports Java and Kotlin exceptions only: no native crashes, no ANRs, no low-memory kills. For those devices, Play Console's vitals is your source. A crash report has no screenshot and no replay, because the handler runs in a dying process. The SDK reads Timber output plus System.out and System.err, not the logcat buffer, so plain android.util.Log lines are left out of reports (see Console & network in the Android docs). Native crash and ANR capture runs in your main process only, and a crash in the moment before the SDK finishes its background setup is not reported. Reports also arrive on the next launch, so a crash can show up days after it happened.
If you want to try it next to what you already run, the Free plan covers 1,000 monthly active installs with unlimited crash reports. Setup is two Maven artifacts and one start call, described on the Android SDK page.
What to do with a crash log, in order
- Find the right log. A Java or Kotlin exception is in the logcat crash buffer, an ANR in /data/anr, and a native crash in a tombstone. For users' phones, use vitals or your crash reporter.
- Retrace it. If you see names like a.b.c, run retrace with the mapping.txt from that exact build. For native frames, use ndk-stack with the unstripped libraries.
- Read the last cause, then your first frame. The exception type tells you what failed. The first frame in your package tells you where.
- Rule out the system. DeadSystemException means the OS restarted under you. Group those crashes separately instead of debugging your own code.
- Keep every release's mapping.txt and symbols. Without them, next month's crash log is unreadable.